|
|
Where Have We Been?
UC Davis Information Technology Statistics
The following charts illustrate trends in key Information Technology services during the period from 1995 to 1999.

This chart indicates a steady increase in the total number of email messages received and sent via the UC Davis network from Fall 1995 to Fall 1999. Clearly, email has become a central fact of life for many of us, and the trend suggests that its use continues to grow.
|

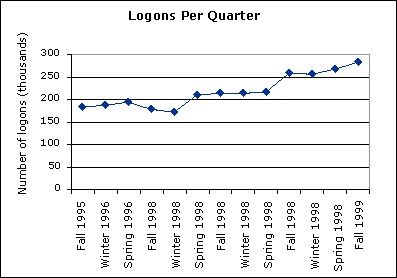
This chart illustrates the total number of student logons to the UC Davis network from on-campus computer rooms. Most often, students access the network to send and receive email and to surf the Web. One reason for the increase in logons can be attributed to the increase in computer rooms over the last five years. This chart does not include data on logons via remote access.
|

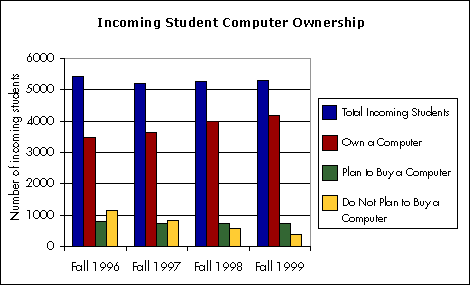
This chart indicates a growing number of incoming students are arriving with computers in tow. Predictably, as the number of owners has increased, the number of students who do not plan to buy a computer has decreased. Computers are such a critical tool for students that the Academic Computing Coordinating Council is working on recommendations for student computer ownership (see http://ac4.ucdavis.edu for more information).
|

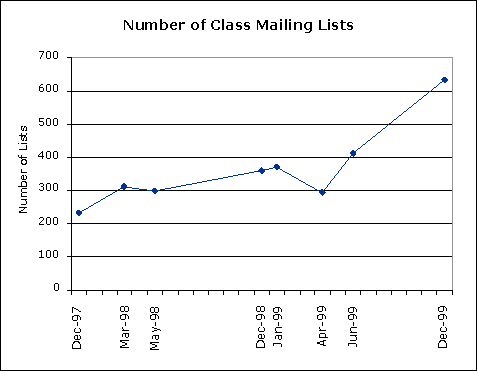
Class listservs are becoming an important tool in many courses. An increasing number of instructors are turning to email to enhance communication with students and distribute course materials. According to a recent UC Davis faculty survey (see http://lead.ucdavis.edu/results.html), over half suggest their students use email, and 36 percent require students to use it as a regular part of their courses.
|
|
|

